MACD(マックディー)は、MT5で簡単に使えます。でも、デフォルトのままだと、微妙に見づらいんですよね。変更する方法と、おすすめの設定値について解説してみました。
MACDとは何?
MACDは、Moving Average Convergence Diivergenceの略です。
MACDは、短期指数平滑移動平均線(EMA)と長期指数平滑移動平均線(EMA)の2本のEMAの期間の移動平均の差を利用したテクニカル指標です。
MACDのおすすめの設定値
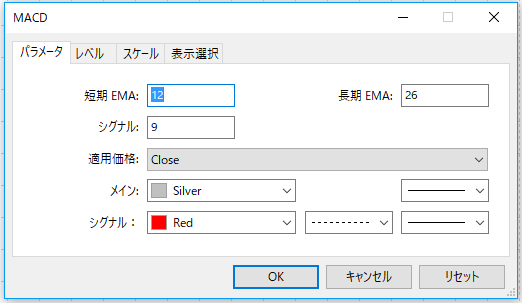
MACDの設定値は決まっています。主に、EMAは12と26、シグナルの平均期間は9を使います。
- 短期EMA:12
- 長期EMA:26
- シグナル平均期間:9
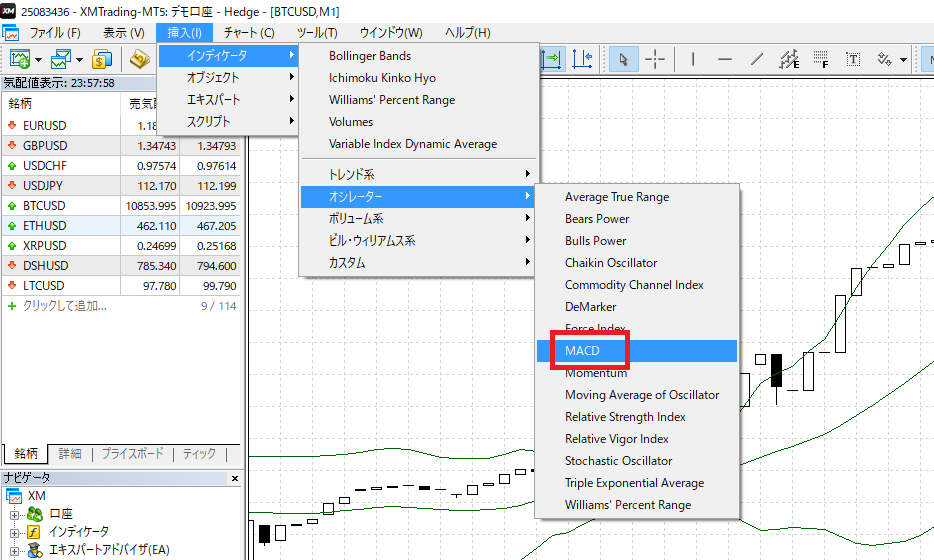
MT5でのMACD導入方法
メニューより、「挿入」⇒「インディケータ」⇒「オシレーター」⇒「MACD」を選択します。
数値はそのままでOKです。MACDでの基本となる設定値があらかじめ入っているので、そのまま。
MT5のMACDはヒストグラム表示
FXの書籍でみるMACDと違う事がわかると思います。
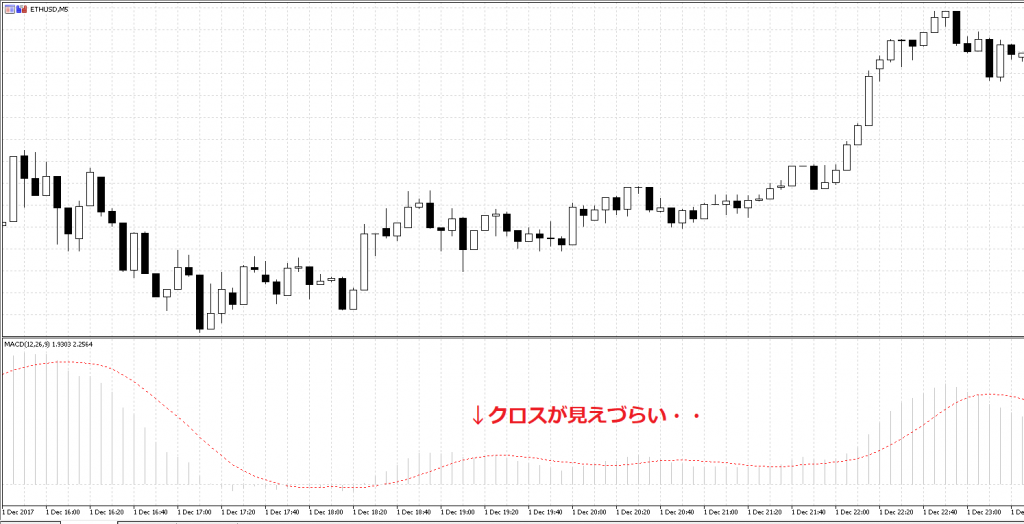
このまま使っても良いのですが、MACDがヒストグラム表示なので、すごく違和感を感じます。
シグナルとクロスしている箇所が見づらいです。どこでクロスしているかが、MACDを使う肝になりますが、このままでは分かりません。
ここがMT4、MT5の欠点です。
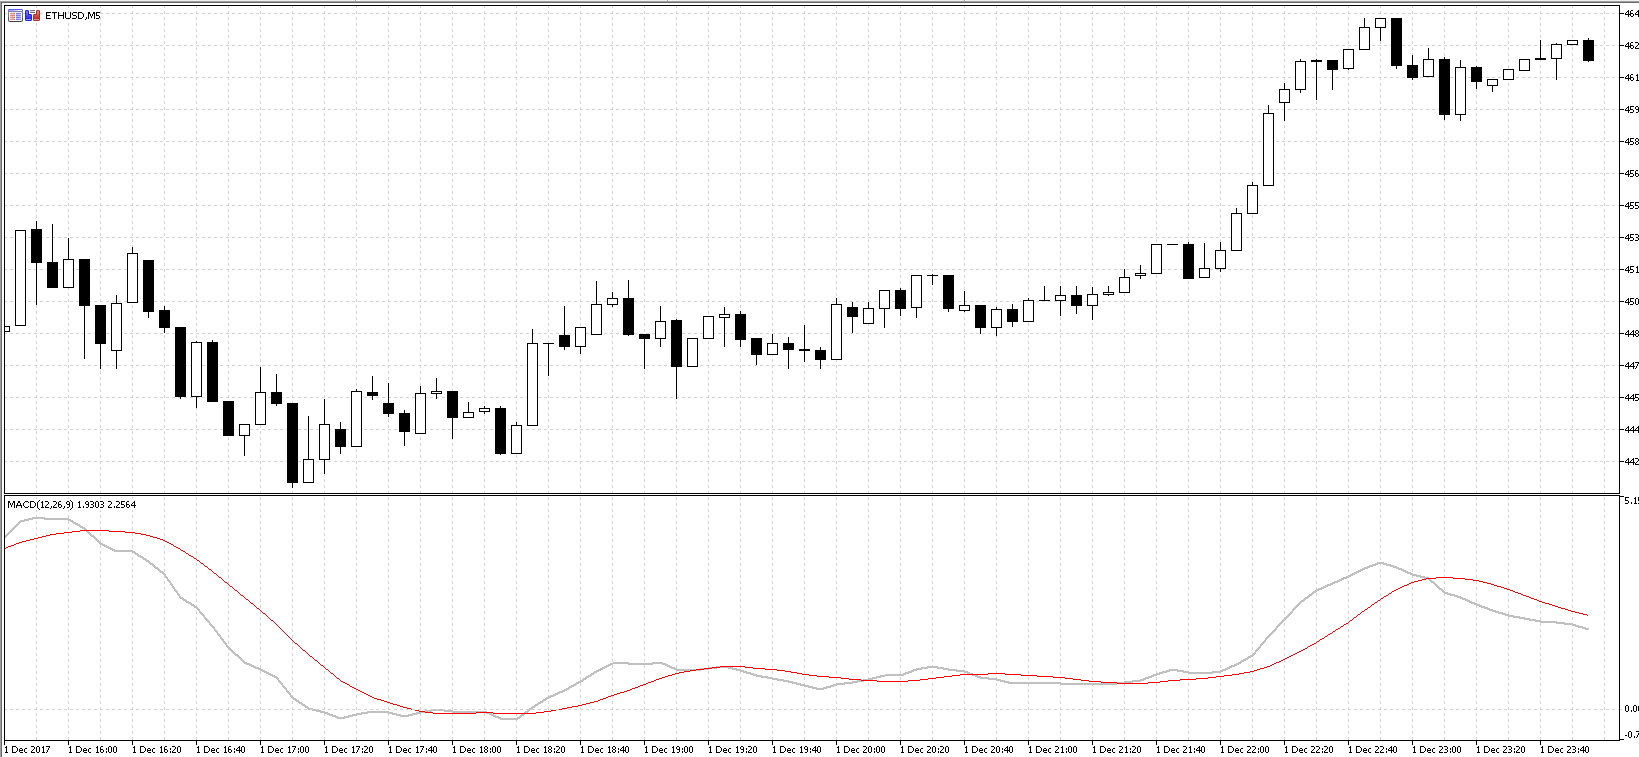
海外ではこの方が当たり前なのかもしれませんが、日本の書籍のように、線で表示したいですよね。
MT5でMACDをヒストグラムからライン(線)に変更する方法
それには少し、MACDのインディケーターを表示するプログラムを修正する必要があります。
プログラムって聞くと敷居が高く聞こえますが、やり方は簡単なので説明します。ただ、ご注意して頂きたいのが、MT4とMT5ではソースコードが違います。ここで説明するのは、MT5です。
Metaエディタを起動する
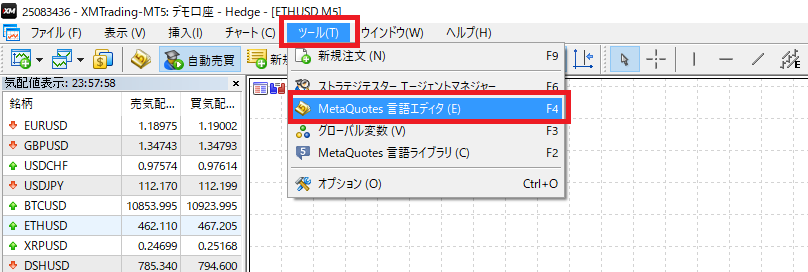
まず、ソースを修正するため、メタエディタを起動します。メニューから、「ツール」⇒「MetaQuotes言語エディタ」を選びます。
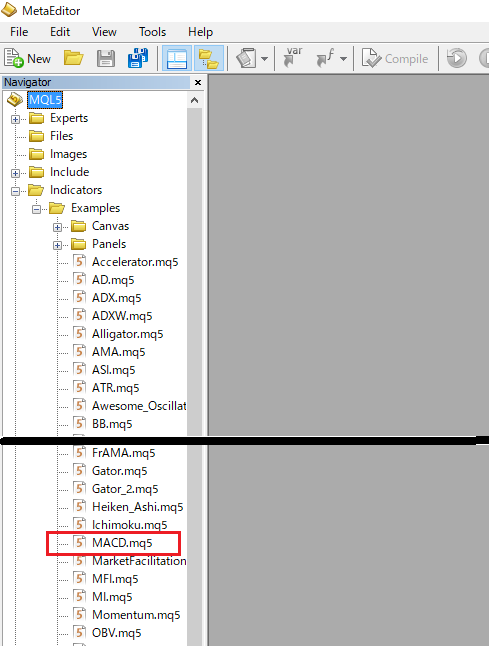
MetaEditorが起動したら、左サイドバーより、「Indicators」⇒「Examples」⇒「MACD.mql5」を選びます。
ソースコード修正
修正する箇所は1箇所です。
修正前
#property indicator_type1 DRAW_HISTOGRAM
DRAW_HISTOGRAMから、DRAW_LINEに変更します。
修正後
#property indicator_type1 DRAW_LINE
めちゃめちゃ簡単です。
修正後のソースコード全体
修正後の全体のソースコードも書いておきます。再度、念を押して言いますが、対応しているのはMT5です。
//+------------------------------------------------------------------+
//|                                                         MACD.mq5 |
//|                   Copyright 2009-2017, MetaQuotes Software Corp. |
//|                                              http://www.mql5.com |
//+------------------------------------------------------------------+
#property copyright   "2009-2017, MetaQuotes Software Corp."
#property link        "http://www.mql5.com"
#property description "Moving Average Convergence/Divergence"
#include <MovingAverages.mqh>
//--- indicator settings
#property indicator_separate_window
#property indicator_buffers 4
#property indicator_plots   2
#property indicator_type1   DRAW_LINE    //2017.12.03 modified by investment-vmoney.com
#property indicator_type2   DRAW_LINE
#property indicator_color1  Silver
#property indicator_color2  Red
#property indicator_width1  2
#property indicator_width2  1
#property indicator_label1  "MACD"
#property indicator_label2  "Signal"
//--- input parameters
input int                InpFastEMA=12;               // Fast EMA period
input int                InpSlowEMA=26;               // Slow EMA period
input int                InpSignalSMA=9;              // Signal SMA period
input ENUM_APPLIED_PRICE InpAppliedPrice=PRICE_CLOSE; // Applied price
//--- indicator buffers
double                   ExtMacdBuffer[];
double                   ExtSignalBuffer[];
double                   ExtFastMaBuffer[];
double                   ExtSlowMaBuffer[];
//--- MA handles
int                      ExtFastMaHandle;
int                      ExtSlowMaHandle;
//+------------------------------------------------------------------+
//| Custom indicator initialization function                         |
//+------------------------------------------------------------------+
void OnInit()
  {
//--- indicator buffers mapping
   SetIndexBuffer(0,ExtMacdBuffer,INDICATOR_DATA);
   SetIndexBuffer(1,ExtSignalBuffer,INDICATOR_DATA);
   SetIndexBuffer(2,ExtFastMaBuffer,INDICATOR_CALCULATIONS);
   SetIndexBuffer(3,ExtSlowMaBuffer,INDICATOR_CALCULATIONS);
//--- sets first bar from what index will be drawn
   PlotIndexSetInteger(1,PLOT_DRAW_BEGIN,InpSignalSMA-1);
//--- name for Dindicator subwindow label
   IndicatorSetString(INDICATOR_SHORTNAME,"MACD("+string(InpFastEMA)+","+string(InpSlowEMA)+","+string(InpSignalSMA)+")");
//--- get MA handles
   ExtFastMaHandle=iMA(NULL,0,InpFastEMA,0,MODE_EMA,InpAppliedPrice);
   ExtSlowMaHandle=iMA(NULL,0,InpSlowEMA,0,MODE_EMA,InpAppliedPrice);
//--- initialization done
  }
//+------------------------------------------------------------------+
//| Moving Averages Convergence/Divergence                           |
//+------------------------------------------------------------------+
int OnCalculate(const int rates_total,
                const int prev_calculated,
                const datetime &time[],
                const double &open[],
                const double &high[],
                const double &low[],
                const double &close[],
                const long &tick_volume[],
                const long &volume[],
                const int &spread[])
  {
//--- check for data
   if(rates_total<InpSignalSMA)
      return(0);
//--- not all data may be calculated
   int calculated=BarsCalculated(ExtFastMaHandle);
   if(calculated<rates_total)
     {
      Print("Not all data of ExtFastMaHandle is calculated (",calculated,"bars ). Error",GetLastError());
      return(0);
     }
   calculated=BarsCalculated(ExtSlowMaHandle);
   if(calculated<rates_total)
     {
      Print("Not all data of ExtSlowMaHandle is calculated (",calculated,"bars ). Error",GetLastError());
      return(0);
     }
//--- we can copy not all data
   int to_copy;
   if(prev_calculated>rates_total || prev_calculated<0) to_copy=rates_total;
   else
     {
      to_copy=rates_total-prev_calculated;
      if(prev_calculated>0) to_copy++;
     }
//--- get Fast EMA buffer
   if(IsStopped()) return(0); //Checking for stop flag
   if(CopyBuffer(ExtFastMaHandle,0,0,to_copy,ExtFastMaBuffer)<=0)
     {
      Print("Getting fast EMA is failed! Error",GetLastError());
      return(0);
     }
//--- get SlowSMA buffer
   if(IsStopped()) return(0); //Checking for stop flag
   if(CopyBuffer(ExtSlowMaHandle,0,0,to_copy,ExtSlowMaBuffer)<=0)
     {
      Print("Getting slow SMA is failed! Error",GetLastError());
      return(0);
     }
//---
   int limit;
   if(prev_calculated==0)
      limit=0;
   else limit=prev_calculated-1;
//--- calculate MACD
   for(int i=limit;i<rates_total && !IsStopped();i++)
      ExtMacdBuffer[i]=ExtFastMaBuffer[i]-ExtSlowMaBuffer[i];
//--- calculate Signal
   SimpleMAOnBuffer(rates_total,prev_calculated,0,InpSignalSMA,ExtMacdBuffer,ExtSignalBuffer);
//--- OnCalculate done. Return new prev_calculated.
   return(rates_total);
  }
//+------------------------------------------------------------------+
コンパイル
修正したら、コンパイルします。プログラムが書いてあるソースコードは、修正しただけではプログラムに反映しません。
コンパイルして、実行ファイル(mql5)を生成する必要があります。
メニュー部分にある「Compile」ボタンを押すと、コンパイルできます。
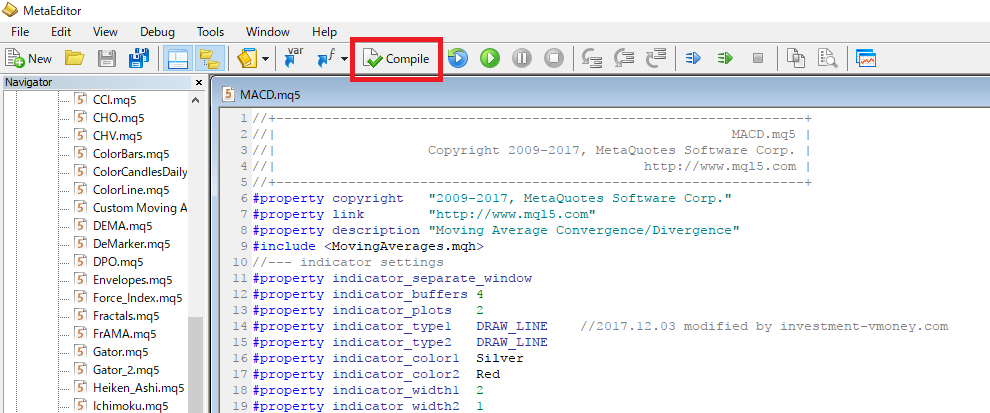
簡単な修正なので、何もエラーがでないと思います。
修正版のMACDを実行してみる
MT5に戻ります。
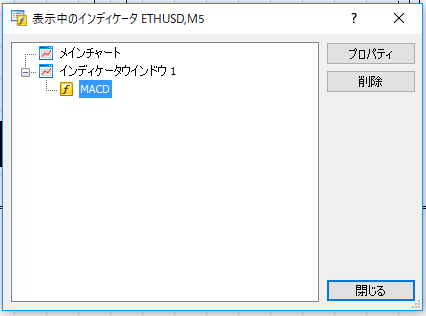
実施の前に、さっきのMACDを消しておきます。メニューバーより、「チャート」⇒「インディケータリスト」をクリックします。
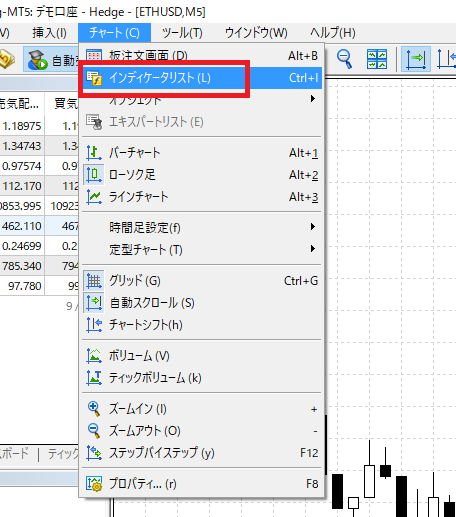
表示中のインディケータやEAが表示されます。さきほど起動していたMACDを削除します。
真っさらなチャートに戻ったら、今修正した修正版MACDを実行してみます。
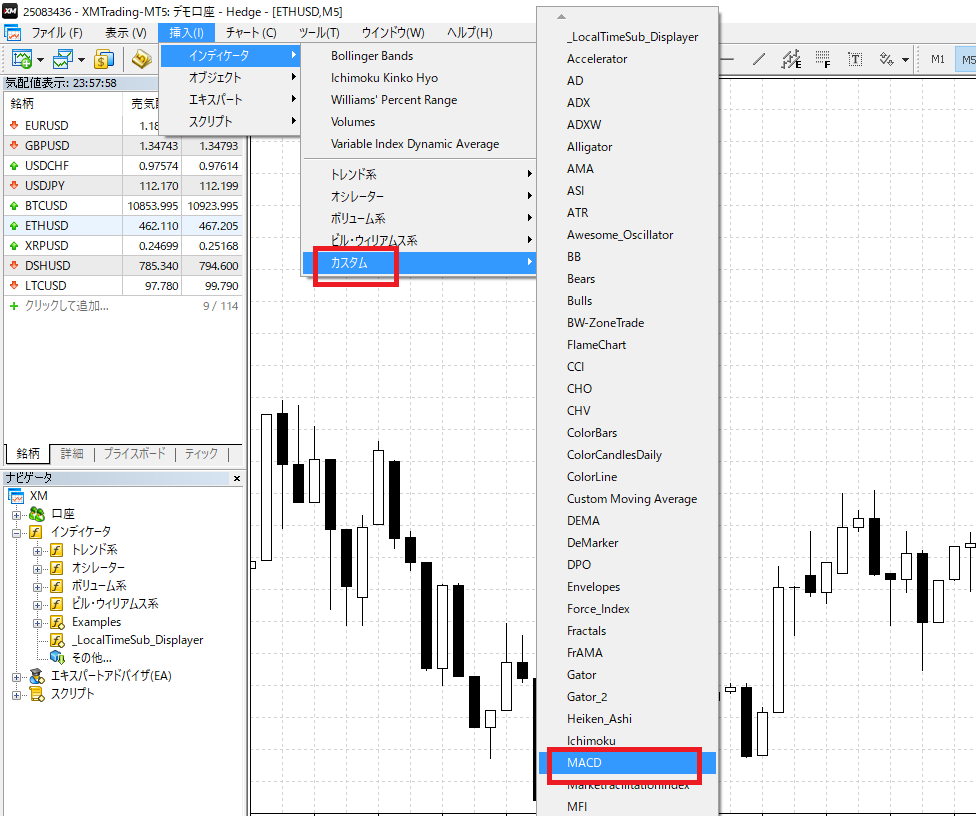
修正版は、インディケータ⇒カスタムから実行
修正版は実施方法が若干違います。
メニューより「挿入」⇒「インディケータ」⇒「カスタム」⇒「MACD」を選びます。「カスタム」に分類されるのでご注意ください。
色の設定は任意。OKをおすと、以下のように表示されます。
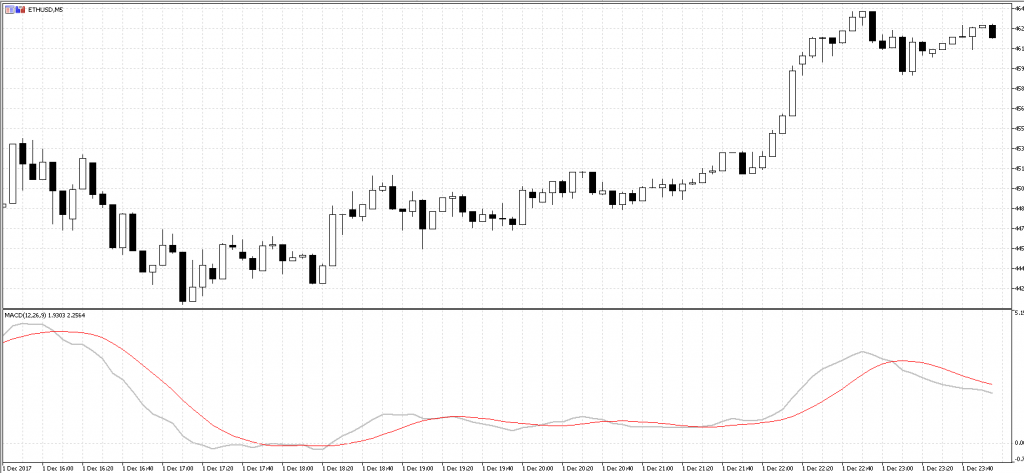
断然見やすいです!。雲泥の差です。
MACDとシグナルのゴールデンクロス、デッドクロスが、よく分かるようになりました。
以上になります。


ご質問はコメント欄からお願いします